

Based on the most recent European surveys, cannabis use in the past year among the EU population aged 15 to 34 is estimated at 15.1% (15.3 million individuals). Considering that men are generally twice as likely to report consumption as women, it is unsurprising that these figures may be slightly higher when accounting for this potential reporting bias.
Among young people aged 15 to 24, it is estimated that 18.2% (8.6 million) used cannabis in the past year, while 9.6% (4.5 million) reported use in the past month.
Approximately 1.3% (3.7 million) of adults aged 15 to 64 are daily or near-daily cannabis users, defined as consumption on 20 or more days within the last month.
Within the 15–34 age group, an estimated 2.0% (2 million) use cannabis on a daily or near-daily basis. Roughly three-quarters of adult users (aged 15 to 64) are men, and the majority (54%) are under the age of 35.
National trends in cannabis use vary. Among the countries that have conducted surveys since 2021 and reported results, three recorded higher estimates, eight remained stable, and two reported lower estimates compared with their previous comparable surveys.
The 2021 European Web Survey on Drugs indicated that 95% of respondents who had used cannabis in the preceding 12 months consumed cannabis herb, compared with 32% who used resin, 25% who consumed edibles, and 17% who used extracts.
The consumption data presented in the following chart are based on general population surveys submitted to the European Drugs Agency (EUDA) by national focal points and are drawn from studies conducted between 2013 and 2023.
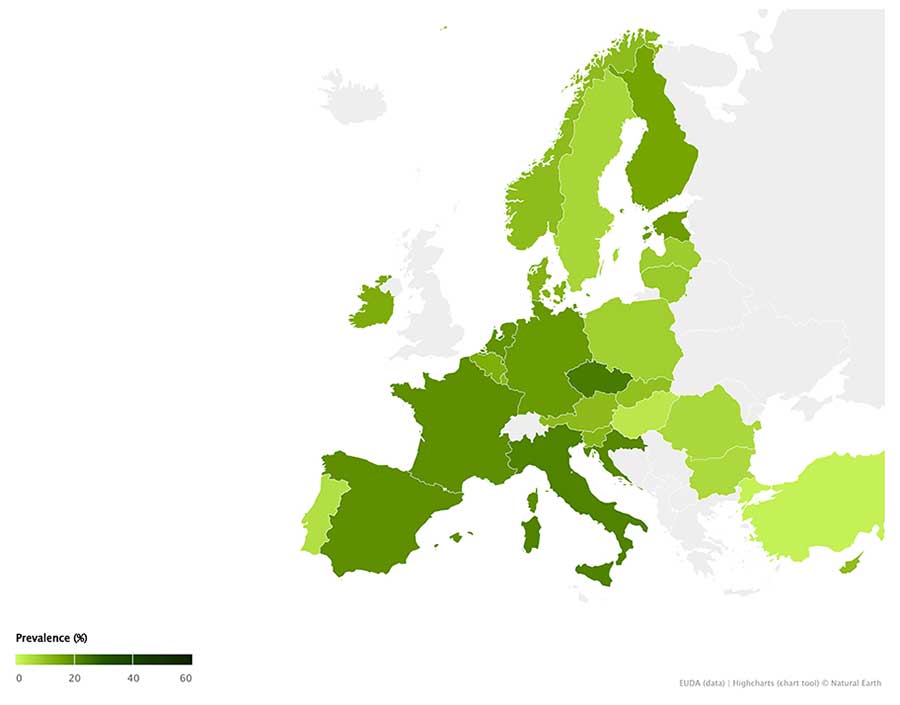
Clicking on the map will open a new browser window with a data explorer that will allow us to view detailed consumption data by reference period and age range, or we can also access data broken down by country by clicking on the map or selecting a country from the drop-down menu.
Cannabis Residues in Wastewater from Selected European Cities: Latest Data
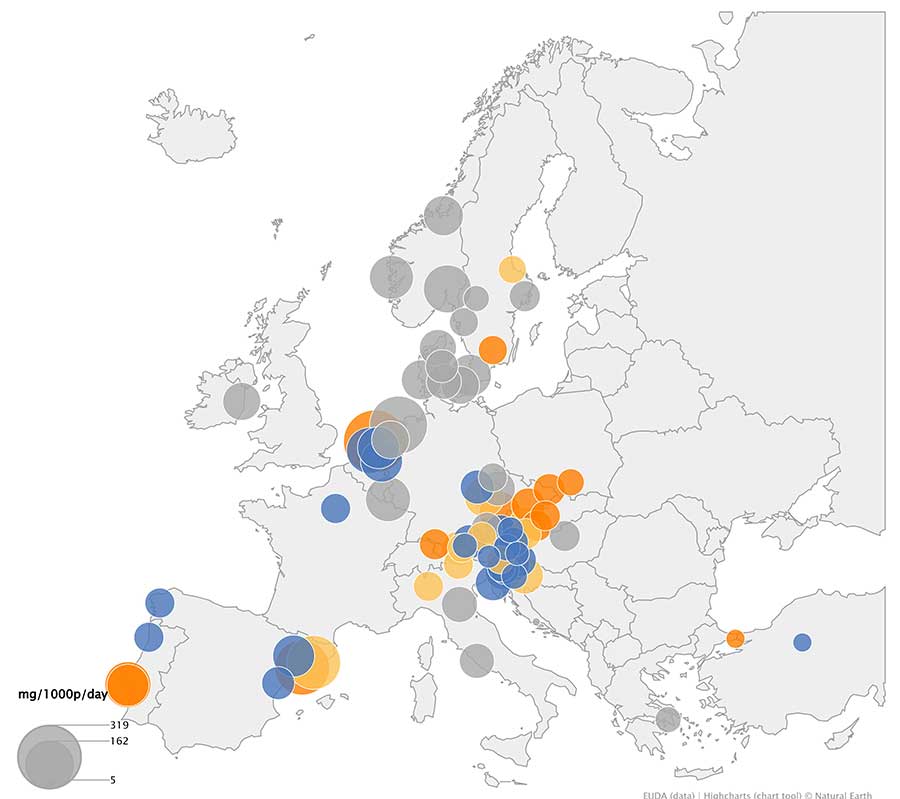
It is noteworthy that in 2023, among the 51 cities with comparable data, 20 reported an annual increase in the cannabis metabolite THC-COOH detected in wastewater samples, while 15 reported a decrease.
The following chart displays the average daily quantities of THC-COOH, measured in milligrams per 1,000 inhabitants. In most cities, sampling was carried out over a one-week period between March and May 2023.
Red circles indicate an increase compared with previous values; yellow circles indicate stable levels; blue circles reflect a decrease; and grey circles represent current values that cannot be compared due to the absence of prior data.
The table below presents the 2024 values for the cannabis metabolite, distinguishing between weekday and weekend averages, for the 80 European cities for which validated data are available.
| Country | City | Weekend mean | Daily mean | Country: City |
|---|---|---|---|---|
| AT | Graz | 70.14 | 66.17 | AT: Graz |
| AT | Hall-Wattens | 50.57 | 49.73 | AT: Hall-Wattens |
| AT | Innsbruck | 79.85 | 79.05 | AT: Innsbruck |
| AT | Kapfenberg | 56.24 | 53.46 | AT: Kapfenberg |
| AT | Klagenfurt | 46.6 | 42.84 | AT: Klagenfurt |
| AT | Knittelfeld | 38.03 | 39,00 | AT: Knittelfeld |
| AT | Kufstein | 70.09 | 74.09 | AT: Kufstein |
| AT | Purgstall | 41.47 | 38.52 | AT: Purgstall |
| AT | Region Millstättersee | 26.17 | 25.8 | AT: Region Millstättersee |
| AT | Ried im Innkreis | 59.03 | 58.15 | AT: Ried im Innkreis |
| AT | Salzburg | 51.76 | 50.76 | AT: Salzburg |
| AT | Steyr | 77.33 | 61.54 | AT: Steyr |
| AT | Strass im Zillertal | 33.19 | 31.97 | AT: Strass im Zillertal |
| AT | Wasserverband Hofsteig | 56.53 | 55.86 | AT: Wasserverband Hofsteig |
| AT | Wien | 84.42 | 87.34 | AT: Wien |
| AT | Wiener Neustadt | 55.28 | 55.94 | AT: Wiener Neustadt |
| AT | Wildon | 33.27 | 31.32 | AT: Wildon |
| CH | Basel | 35.7 | 30.7 | CH: Basel |
| CH | Berne | 50.83 | 47.01 | CH: Berne |
| CH | Geneva | 150.34 | 145.37 | CH: Geneva |
| CH | Zurich | 92.26 | 87.59 | CH: Zurich |
| CZ | Brno | 69.19 | 72.31 | CZ: Brno |
| CZ | České Budějovice | 117.65 | 118.02 | CZ: České Budějovice |
| CZ | Karlovy Vary | 69.29 | 71.97 | CZ: Karlovy Vary |
| CZ | Ostrava | 65.64 | 61.53 | CZ: Ostrava |
| CZ | Plzeň | 104.9 | 105.41 | CZ: Plzeň |
| CZ | Prague (2) | 83.3 | 80.35 | CZ: Prague (2) |
| CZ | Ústí nad Labem | 48.52 | 47.72 | CZ: Ústí nad Labem |
| DK | Aalborg | 104.56 | 90.62 | DK: Aalborg |
| DK | Aarhus | 67.86 | 65.53 | DK: Aarhus |
| DK | Copenhagen | 122.69 | 123.35 | DK: Copenhagen |
| DK | Esbjerg | 103.88 | 111.19 | DK: Esbjerg |
| DK | Næstved | 95.69 | 93.55 | DK: Næstved |
| DK | Odense | 77.2 | 78.41 | DK: Odense |
| ES | Barcelona | 218.03 | 220.68 | ES: Barcelona |
| ES | Castellon | 65.03 | 65.04 | ES: Castellon |
| ES | Lleida | 117.23 | 121.31 | ES: Lleida |
| ES | Santiago | 54.59 | 54.32 | ES: Santiago |
| ES | Tarragona | 238.06 | 228.9 | ES: Tarragona |
| FR | Paris Seine Centre | 55.1 | 53.88 | FR: Paris Seine Centre |
| GR | Athens | 34.75 | 36.9 | GR: Athens |
| HR | Split | 4.44 | 4.93 | HR: Split |
| HR | Zagreb | 94.01 | 88.8 | HR: Zagreb |
| HU | Budapest | 52.79 | 56.78 | HU: Budapest |
| IE | Dublin | 96.02 | 98.1 | IE: Dublin |
| IS | Reykjavik Klettagarðar | 60.39 | 55.12 | IS: Reykjavik Klettagarðar |
| IT | Bologna | 80.87 | 82.04 | IT: Bologna |
| IT | Bozen | 53.52 | 52.72 | IT: Bozen |
| IT | Milan | 49.85 | 52.28 | IT: Milan |
| IT | Rome | 77.89 | 78.77 | IT: Rome |
| LU | Luxembourg | 117.87 | 140.4 | LU: Luxembourg |
| NL | Amsterdam | 284.09 | 319.46 | NL: Amsterdam |
| NL | Eindhoven | 118.87 | 124.64 | NL: Eindhoven |
| NL | Groningen | 253.95 | 258.08 | NL: Groningen |
| NL | Rotterdam (2) | 143.12 | 147.99 | NL: Rotterdam (2) |
| NL | Utrecht | 112.05 | 122.44 | NL: Utrecht |
| NL | Zwolle | 101.68 | 98.16 | NL: Zwolle |
| NO | Bergen (2) | 123.29 | 132.72 | NO: Bergen (2) |
| NO | Oslo (2) | 167.29 | 163.11 | NO: Oslo (2) |
| NO | Trondheim (2) | 109.27 | 110.78 | NO: Trondheim (2) |
| PL | Krakow P | 39.92 | 41.68 | PL: Krakow P |
| PT | Almada | 114.06 | 119.1 | PT: Almada |
| PT | Lisbon | 136.37 | 150.83 | PT: Lisbon |
| PT | Porto | 56.44 | 53.74 | PT: Porto |
| SE | Gävle | 42.01 | 44.8 | SE: Gävle |
| SE | Karlstad | 37.34 | 36.84 | SE: Karlstad |
| SE | Stockholm (2) | 57.4 | 57.61 | SE: Stockholm (2) |
| SE | Trollhättan | 52.28 | 49.74 | SE: Trollhättan |
| SE | Växjö | 47.13 | 46.85 | SE: Växjö |
| SI | Domžale-Kamnik | 48.08 | 46.61 | SI: Domžale-Kamnik |
| SI | Koper | 75.73 | 81.88 | SI: Koper |
| SI | Kranj | 46,00 | 45.65 | SI: Kranj |
| SI | Ljubljana | 84.16 | 90.21 | SI: Ljubljana |
| SI | Maribor | 75.65 | 64.97 | SI: Maribor |
| SI | Novo mesto | 33.15 | 36.84 | SI: Novo mesto |
| SI | Velenje | 65.44 | 68.18 | SI: Velenje |
| SK | Bratislava C | 58.7 | 58.46 | SK: Bratislava C |
| SK | Piestany | 49.77 | 52.34 | SK: Piestany |
| TR | Ankara | 17.04 | 16.86 | TR: Ankara |
| TR | Istanbul (II-VII) | 16.23 | 16.52 | TR: Istanbul (II-VII) |